- UNIFYBroker Forum
-
 Bugs
Bugs

UNIFYBroker GUI reporting service unavailable intermittently
Hello,
Not sure if this has been reported before, but couldn't see anything on my quick look. I am currently in an environment running Broker v5.3.1 Revision #4, and am experiencing what appears to be a UI bug where randomly the web page will begin to display "Service Unavailable" all over the page.
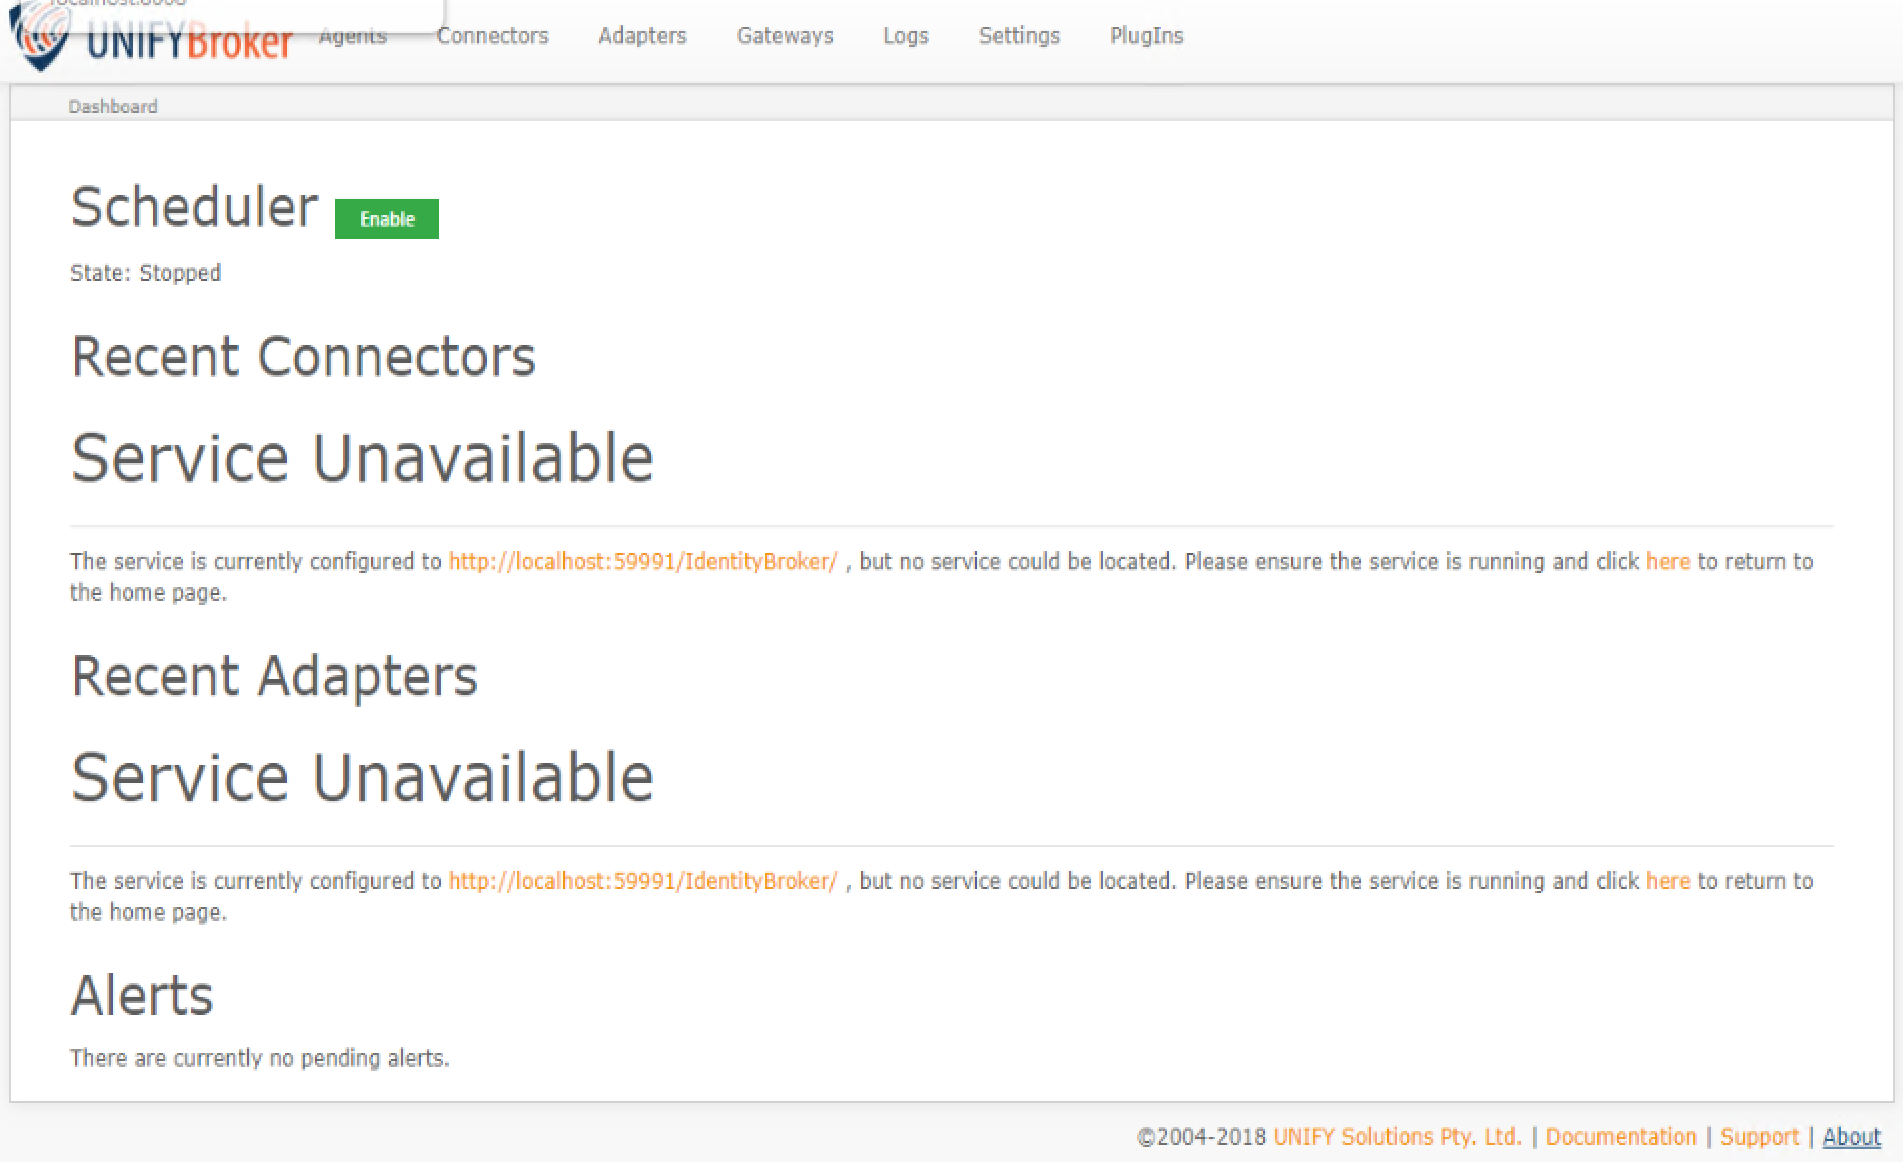
After several seconds to a minute or two, the page will then flick back to normal and continue in this pattern. Some days it will happen more often than others, with no increase in job frequency. Occasionally a service restart will improve the frequency of it occurring, however it will slowly return over time.
I've investigated a bit and it appears to not noticeably affect the current running jobs in UNIFYBroker, nor importing running from Broker into MIM. I have also see it happens more frequently when jobs are running in Broker, but not attributed to any one job in particular. There are also no errors in the Event Log, however there are some in the UNIFYBroker log, though they don't appear to be UI specific, nor can I say I have seen these on every occasion this happens.
The error I'm referring to in particular is:
"Unable to raise complete notification:
System.ApplicationException: This operation returned because the timeout period expired. (Exception from HRESULT: 0x800705B4)
at System.Threading.ReaderWriterLock.AcquireWriterLockInternal(Int32 millisecondsTimeout)
at System.Threading.ReaderWriterLock.AcquireWriterLock(TimeSpan timeout)
at Unify.Framework.Collections.ThreadsafeObjectQueueBase`2.Push(TItem item)
at Unify.Framework.Notification.TaskNotifier`1.Dispose()"
If you need any more information just let me know.
Thanks
Customer support service by UserEcho

Hey Hayden,
Are you running the UI component through the inbuilt web server or through IIS? If you're not using IIS, can I recommend configuring that to see if it helps: https://voice.unifysolutions.net/knowledge-bases/7/articles/2943-configuring-unifybroker-for-use-with-iis
As of broker 5.2, the inbuilt server was deprecated.
Also, are they running on the same server as each other or different servers?
The UI talks to the service over a REST api, and does regular updates through background jquery updates. So if the browser can't get to the backend service, that's when the errors would show. That wouldn't normally affect service functionality - unless the backend service is actually becoming unavailable.
Next time it happens, either check the web browser logs (using the developer console) or use some network tracing tools and refresh the page to see if it's returning any specific errors or if its just timing the connection out between the UI and the API. You can also test pinging the API endpoints through a script or postman style tool.
Hi Matthew,
Sorry I forgot to mention above. The service historically has been running self hosted while this has been occurring, however I did switch it over to IIS a couple of months ago and it still appears to be occurring.
And yes this is all happening on the one server. So the service and the hosting is setup on the same machine.
The service has just been restarted today so I'll keep an eye out and do as you suggested when it happens again.
Thanks
Hi Hayden
There's not much to go off in the browser logs as the issue is with communication between the web service (running on IIS) and Broker, not IIS and the browser. It would be helpful if you could capture this. This traffic is on port 59990 so Fiddler would need to be configured to capture on this port, or use Wireshark/rawcap instead.
Regarding the server, is it running any other services other than Broker and IIS? Does it meet the required specs for Broker plus whatever else is running?
Ok Thanks Beau, I'll see what I can organise with the customer so next time it happens I can use rawcap or something similar to capture some traffic.
Thanks
Yeah, that fine. More than enough to not be responsible for this issue.
Looks like that trace wasn't done on the loopback network adapter. Doesn't contain any of the Broker web requests on localhost. It's not super important until the service unavailable error happens again, anyway.
Hi Beau, Just updating this ticket, this issue is still happening intermittently. Is there anything further I can do to help with this?
Hi Hayden,
Are you noticing this is just happening on the dashboard, or is there other impacts to other pages as well?
In the latest trace you did (which was a while ago), there was only really issues towards the end, which I wonder if it's due to the trace being shut down halfway through a request. Do you recall if there was UI issues on this day also?
A fresh trace may help, where the issue occurs, if possible. There's regular API calls that Broker UI makes to get latest information from the service...some of these may not be returning responses, which is why the UI is showing that the service is unavailable. It's not normally behaviour you'd see, unless there's some firewall issues or a lot of concurrent requests happening at the same time.
If you can get a fresh trace where it captures the issue, that'd be fantastic. Otherwise I can look at providing you a patch which logs some more information in Broker to see if we can narrow it down.
Hi Matthew,
Apologies for the delay in responses but this one is difficult catch between the intermittency itself and also the frequency at which I'm in the particular environment.
To hopefully answer some of your questions I have noticed occurring on pages that display information around entity counts. So dashboard, connectors page, adapters page and individual connectors/adapters. This particular environment can also be quite active in terms of users looking at the Broker UI, so at some times can have 3 or 4 users looking at the UI (so I imagine this may also be a contributing factor).
It hard to recall (because it was so long ago), but I think there were UI issues on this day, for most of the day even though the trace only captured a small amount. I'll keep and eye out for when it happens again and get another trace when it does. I'll also try and get some more information on the state of the service when it does happen (i.e memory/cpu usage, number of running connector, number jobs importing from adapter, number of users with the UI open, etc)
Thanks
Hi Matthew,
Please see attached a fresh trace that was captured while the issue was occurring.
Thanks,
TraceBrokerIssue.zip
Hi Team,
Let me know if you need anything more for this ticket.
I'll also note here that on the particular environments where this is occurring, it is not uncommon for 3 or 4 users to be accessing the GUI at the same time. So I'm not sure if this could be producing a higher than expected load for service, as this is a higher than typical number of users I would see using the GUI concurrently.
Thank you
Hi Beau,
This latest patch seems to have done the trick. I haven't seen any instances of the error in the last couple of weeks.
Thank you for your help