- UNIFYBroker Forum
- UNIFYBroker Service
-
 Questions

High CPU usage for UNIFYBroker service while nothing is running
Hi Team,
A customer has reported high CPU usage for the UnifyBroker service coming to me initial with the following report:
"In the past month we have been getting High CPU (90%) usage of the UnfyBroker service. We are using version v5.3.3. There has been no change in the environment other than the normal Microsoft patches once a month. It is occurring on both our prod and uat environments."
Confirm some further details with the customer I got the following spec information on the hosts and details about the behaviour:
"Specs on the servers.
Name Memory vCPU OS
PRD 16Gb 4 2016
UAT 14Gb 4 2016
Processor type - Intel(R) Xeon(R) Gold 5118 CPU @ 2.30GHz, 2295 Mhz, 1 Core(s), 1 Logical Processor(s)
The high cpu is more often on the uat server which processes the same data as prod for new accounts but the changes during the day are very minimal. The cpu usage does come down after
The utilization in some instances has cleared itself. Some have been by stopping the service. Timing is from 10 mins to an hour for uat. Interestingly on the prd server the time has been for several hours."
Some initial adjustments were made to the scheduler to ensure nothing is overlapping, though this wasn't really happening much anyway. These adjustments did not see any improvement to the situation.
Additionally the customer reported back the entity counts in the connectors to get a gauge for the size of the environment:
"Connector Prod Uat
Employee CSV 10792 10792
Position CSV 10792 10792
Teams 14805 1035
AD 45683 51356
Adapters
Person 10792 10792
Position 10792 10792"
Looking at the extensibility for the setup there are a number of powershell transform in the environment, which may explain some high cpu usage while connectors or running, though doesn't seem to explain why the high cpu usage continues afterwards.
Finally the following resource monitor screenshots were provided to see what is consuming the resources for the service while no connectors are running:
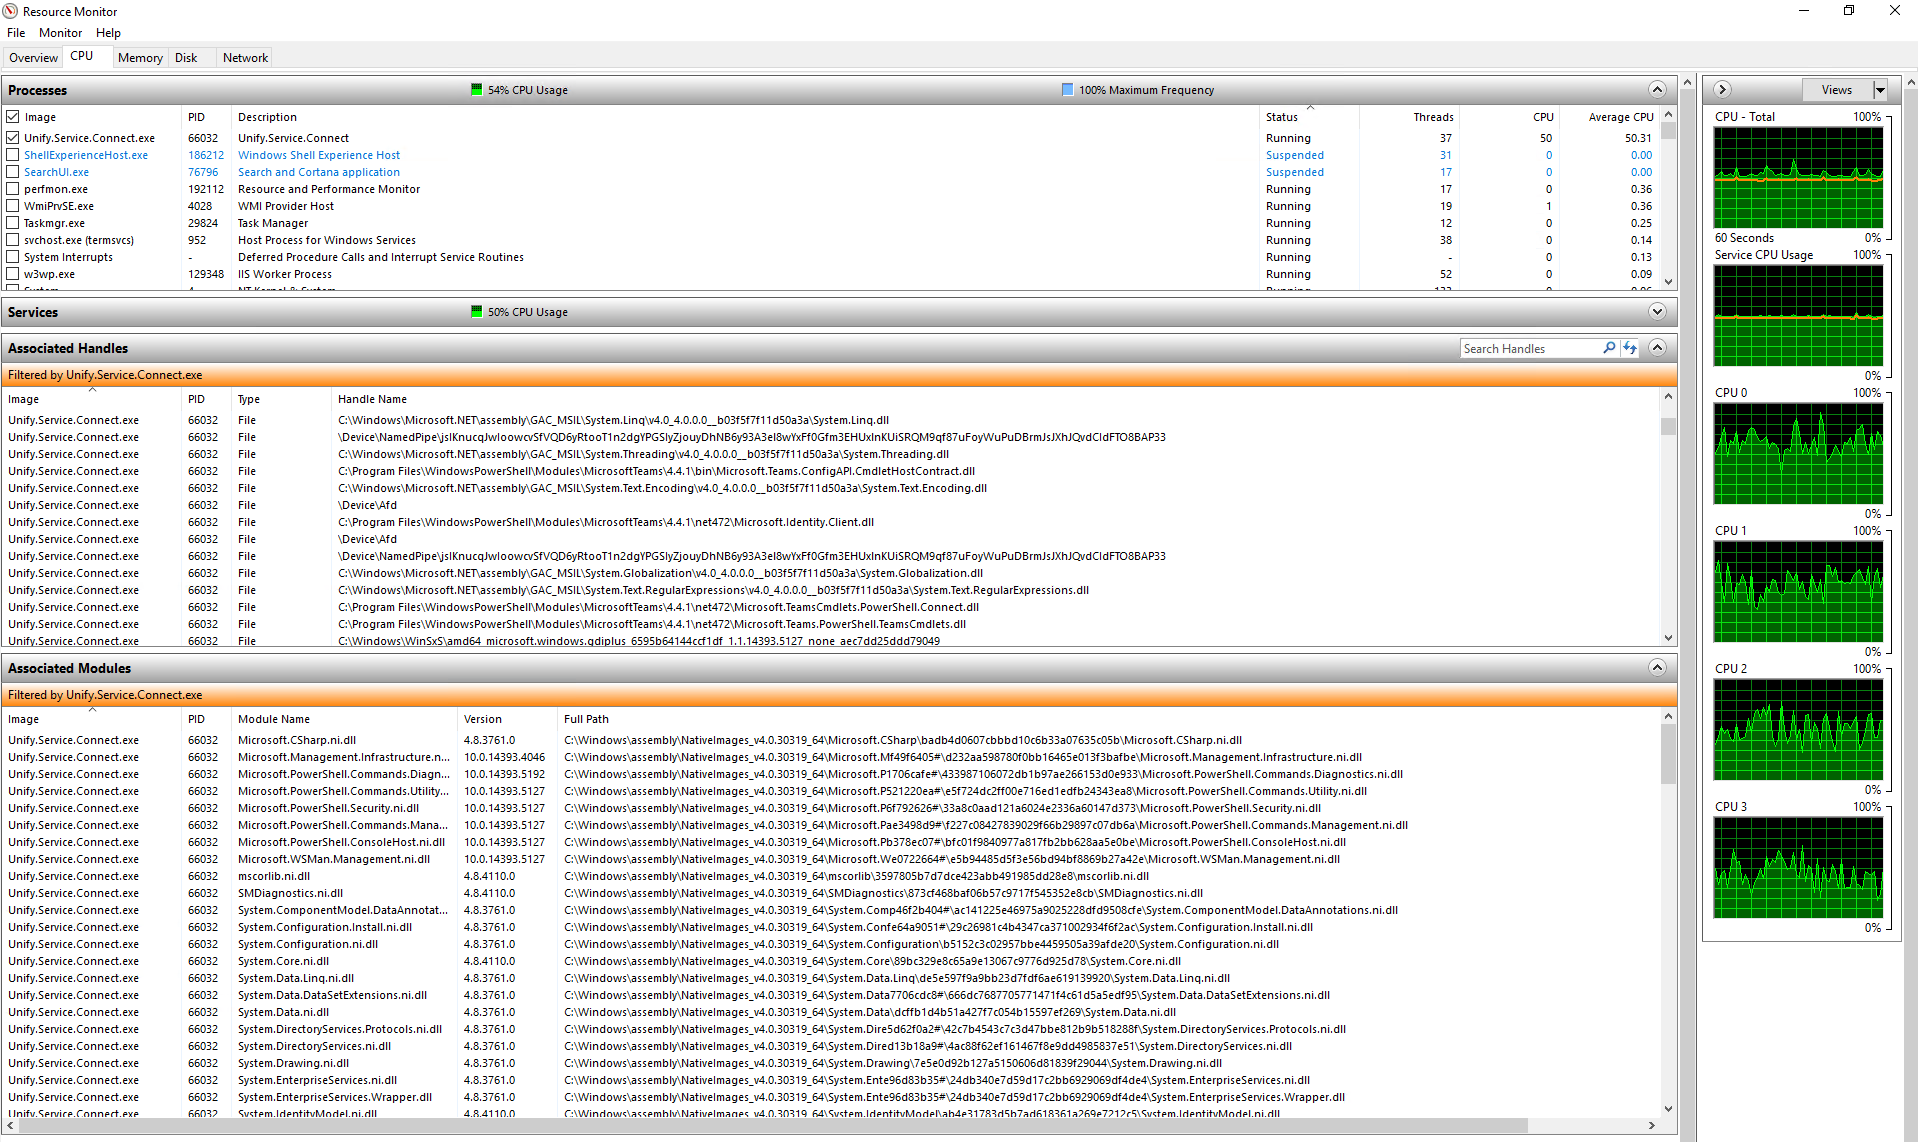
I have confirmed no out of bounds scripts are contacting the service. And that there aren't a large number of WebUI sessions open that could be causing issues. So I am looking for the next steps in troubleshooting this one. Are you able to provide any guidance in figuring out what could be consuming the resources like this?
Let me know if there is any further information I can provide you.
Thanks in advance
Answer

Hi Hayden,
Are you able to provide the config at all? Are there powershell connectors involved with this implementation as well?
Based on the open handles, it looks suspiciously like there's some open objects (for example, teams powershell modules) which may not be dealt with correctly and therefore left open to consume CPU.
Depending on the environment and security requirements, we've had some luck previously using some tools like ProcDump or DebugDiag from Microsoft ( Memory dumps to study a high-CPU performance issue - Microsoft Tech Community ) to get memory dumps when high CPU is happening.
You could also try just a normal memory dump from Task Manager as that might give us a starting point.
This should be resolved with UNIFYConnect V6, with significant improvements to database connectivity, reflection performance, updated powershell versions and improvements in the underlying .net framework.
This can be revisited if the problem can be reproduced on the new version.
Customer support service by UserEcho

This should be resolved with UNIFYConnect V6, with significant improvements to database connectivity, reflection performance, updated powershell versions and improvements in the underlying .net framework.
This can be revisited if the problem can be reproduced on the new version.