- UNIFYBroker Forum
- UNIFYBroker Service
-
 Questions

Deteriorating operation performance over time
Hello,
I have been tracking this issue for a few weeks within an environment. And what I have been noticing is the performance of the UNIFYBroker service deteriorating over time. While there is an existing work around, it would be good to find the root cause of this, whether it be a poorly configured item somewhere or an underlying issue.
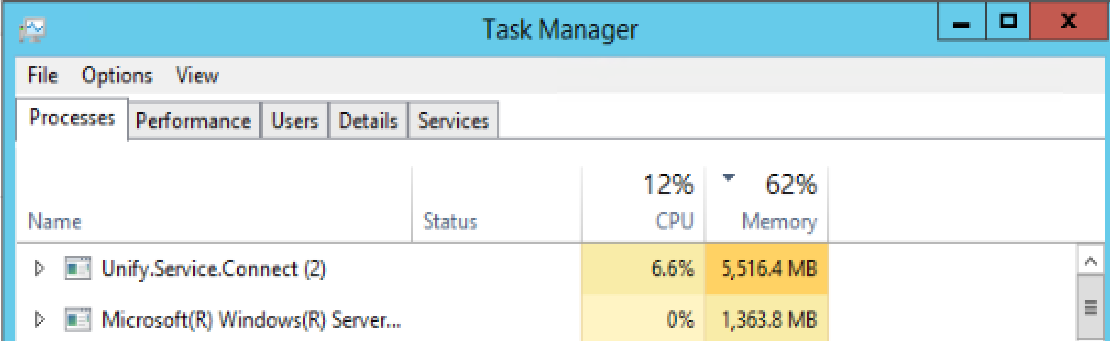
Currently in the environment we notice the service become slower, at a minimum, over the course of about a week. It will gradually take sets of operation lists longer and longer to run. More specifically this will be worse on Monday after all the Full Baseline operations run over the weekend. And then gradually get even worse from there. The only correlation I can see so far is during the times it is running slow, is the service will be using upward of 5GB of ram, even getting to over 10GB if left unattended for longer than a week. It will retain these high levels of memory usage even while no operations are running. The only way to resolve the issue, is to restart the service, which currently happens on a Monday every week.
The environment is quite large with a Broker instance that manages over 1 million entities. However the server (both local and DB) has the specifications to deal with the load. Please see these below. It is also worth noting here also that to eliminate concurrency issues, the scheduling is setup to run everything sequentially (i.e UNIFYNow will step through each operation one at a time and no two operations will run at the same time both in MIM and UNIFYBroker).
Broker Server Specs:
CPU: 16 cores
Memory: 32GB
DB Server Specs:
CPU: 12 cores
Memory: 48GB
Although I haven't gathered this information for previous weeks, I have noticed some strange occurrences this morning and have documented them below:
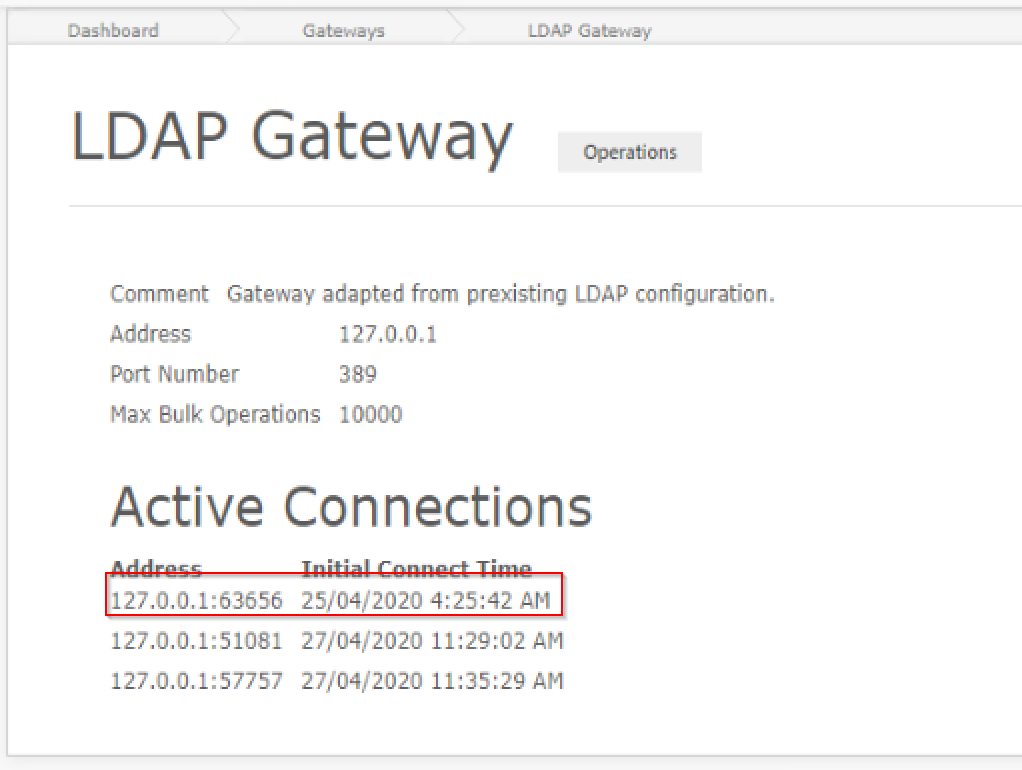
- Old LDAP Gateway connection that has not been closed:
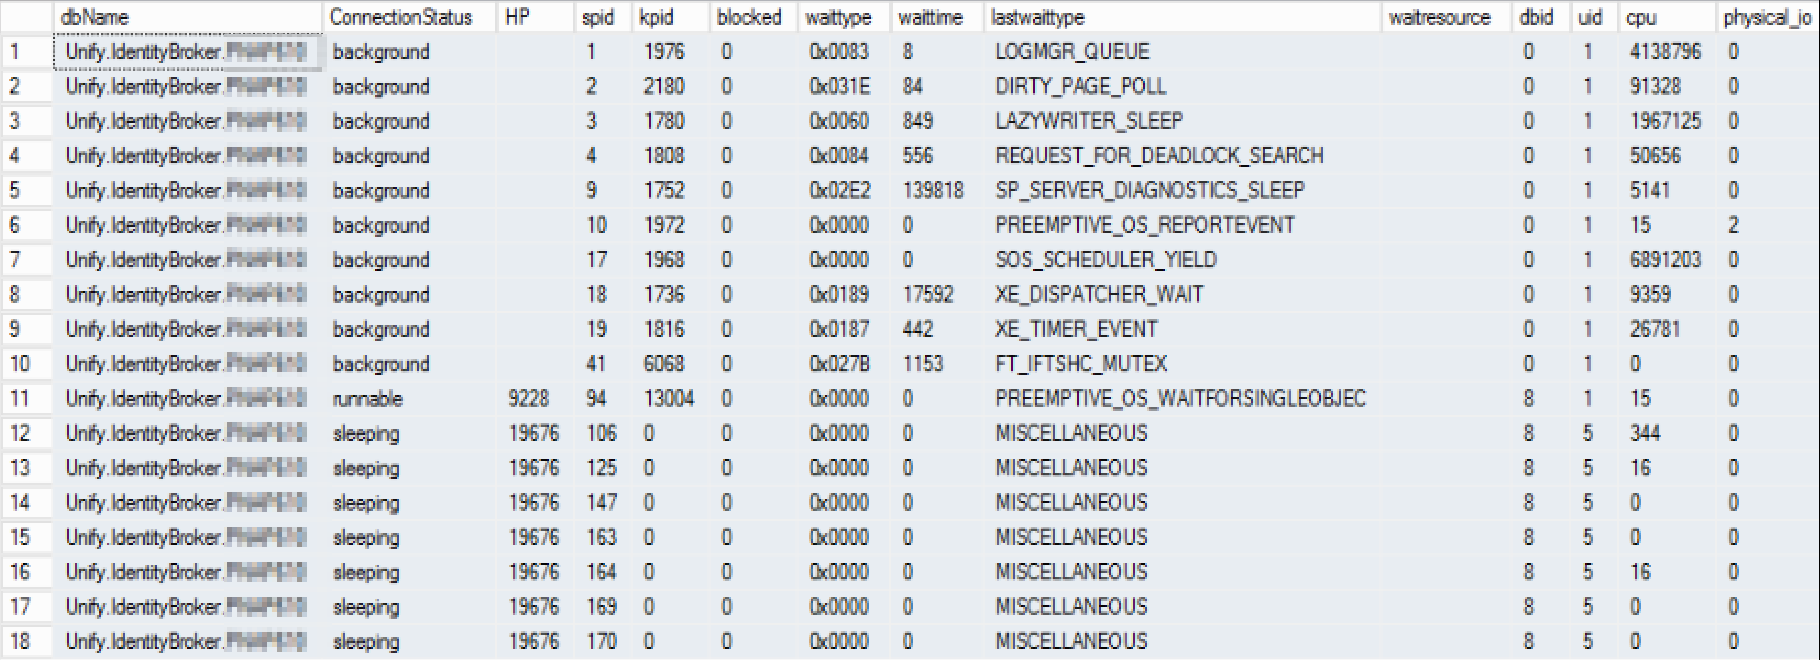
- Large number of SQL Connection to the UNIFYBroker DB:
- High service memory usage while nothing is running (as mentioned before)
I will attach the logs and additional information below. Also in the logs below I have included information on the DB connections both before and after recycle the LDAP Gateway. But also note that recycling the LDAP Gateway also had no effect on the memory usage of the service. Let me know if there was anything else I can do to assist.
UNIFYBroker: v5.3.1
Customer support service by UserEcho

Hi Hayden,
Initial analysis of the process dump revealed a large number of unreleased internal objects from the library Broker uses to execute PowerShell scripts, and seem to be related to remote PowerShell calls. Do any remote call get made in any of your PowerShell connectors/transformation/etc? If you could attach the scripts loaded by Broker that would also be helpful.
Can you check the default PowerShell version on that server? Run
$PSVersionTable.PSVersion.ToString()in a PowerShell console, or(Get-Host).Version.ToString()if that happens to fails. I'll also need you to check that Broker is correctly using the same version. The easiest way of doing this is probably creating a new PowerShell connector with a field populated by the above command and running an import.Next, can you check the versions of
System.Management.Automationthat Broker may be using. If you happen to have the .NET Framework SDK installed, you can use this command:Since that's probably not the case, check the contents of this directory. It should exist with at least one versioned sub-directory containing a dll. Zipping the contents of this directory and attaching it here is probably the best option.
Hi Beau,
I have gone through the scripts briefly and will send you a reply separate as I cannot make it private here.
Thanks
Hey Hayden,
While I would imagine it would be a good idea to call close functions for things like WebService and SQL connections if they're available, based on the memory dump analysis I'd say its something to do with the Exchange remote sessions.
Not sure how to check the active remote sessions on the client. There is Computer Management > System Tools > Shared Folders > Sessions, but I think that may only show sessions where the local machine is the server. See if you can figure out how to find this the next time the service gets bogged down. Don't worry if you can't, as may not even be the actual sessions being kept open, but rather the PowerShell library not cleaning its resources up properly.
To start with, add
Remove-PSSessionto the scripts whereNew-PSsessionare called and see if it makes a difference. Regardless of the result, another memory dump after its been running for week would be helpful. Also, I'd recommend using thetry-catch-finallypattern to ensure the session is safely handled. For example:Thanks Beau,
I've made those changes to the exchange scripts and restarted the service. I'll keep an eye on it for a week or so and let you know how it goes. Thanks again.
Hi Beau,
I've checked the environment this morning after a weekend of full runs and I've still noticed some increase in memory that don't seem to be releasing. I will send you a link to the new memory dump I created today.
Thanks
Hi Hayden
Looks like the same behaviour as before.
I have discovered that .Net hosted PowerShell will keep any output from a script in memory, even after the script has completed running. For example, running this as part of a script in Broker increases memory usage by almost 300Mb per execution due to the output including one thousands lists of the current processes
for ($i = 0; $i -lt 1000; $i++)
{
    Get-Process *
}
This isn't necessarily the cause of your problem as, at least in my tests with with
Get-Processwhile average memory usage was notably higher, it was released eventually. It may still be a contributing factor, though, if remote session objects that aren't being release exist due to being part of the output from your scripts.Since Broker doesn't use the output of scripts anyway, I'd like to try suppressing script output. You do this number of ways. Output from individual methods can be suppressed by assigning their return value to void variables (ie:
$void = Get-Process *), or for a block of code using a script block with the call operator redirecting all output streams to null:&{ ... } *> $null.Given the scripts in use here, I'd probably recommend you use the latter, wrapping the
Import-Modulecalls in the connector scripts, like this:&{ Import-Module 'C:\Scripts\... } *> $nullIf this appears to fix the memory issue I'd like to see another memory dump, no need if it doesn't though. Also let me know if there's any problems running your scripts inside a script block.
My preferred way to avoid this issue is to cast the output from a command to the void type, i.e.
This avoids the use of meaningless variables.
Of course in an ideal world the module you're calling via Invoke-Module should not be writing output, or if it is then it should be doing so for a well-defined reason and the calling code should be expected to handle it appropriately.
Every scriptblock, function and command in PowerShell can produce output, and that includes the for() command as well:
So one way to deal with the "Get-Process *" example above is:
[void] {
    for ($i = 0; $i -lt 1000; $i++)
    {
        Get-Process *
    }
}
This may not be a particularly elegant syntax, but it can sometimes be quite useful to know about.
Hi Beau,
Unfortunately there was still increased memory usage this morning. Sitting around 8GB since applying these changes on Thursday last week. I'll will send you through separately the link to the latest memory dump.
Thanks
Hi Beau,
Did you manage to get a chance to look through the latest memory dump? Let me know if you need access to download it again.
Thanks
Hi Hayden,
Yes I did, sorry for not getting back to you sooner. It turns out that the scripts with
PSSessioncalls that I was getting you to change aren't actually being called by Broker, so my theory that they were responsible has fallen though. Would you be able to confirm this, just to be sure?I'm currently running some test environments to attempt to recreate the issue, but progress is slow due to the time frame required for the tests.
Hi Beau,
No worries. I believe those scripts with the PSSession calls are being called by one of the Exchange connectors, I just checked the extensibility and the scripts themselves and its configured to call them.
In saying that though all of these should be handled correctly now using the method mentioned above.
Thanks
In the scripts and extensibility you provided earlier there's no reference to any of the exchange scripts. Are these out-of-date/incorrect, or are these exchange connectors in a different environment? If the former, can you provide up-to-date extensibility?
In the case of the latter,
In either case, also provide your up-to-date scripts, just so I'm looking at what actually being run.
Hi Beau,
Sorry for the confusion, I thought I provided the scripts/extensibility/memory dump from the same environment, I will re-upload these in their current state (with changes made to scripts). However another environment with a very similar setup/scripts is also having this same issue. I will upload the extensibility/scripts for this one also. Please note I haven't made the changes to the scripts in this other environment yet as I was want to work it out in this first environment.
Thanks
Hi Beau,
I have also noticed this happening at a completely different site now. Would a memory dump from this site also help?
Thanks
Just provide the the extensibility config and any relevant details (version, process memory size, restart frequency, entity count, etc) for now.
No worries, please see the details below:
Memory generally sits around ~5GB though over time this increases to >10GB, sometimes even >15GB if left long enough. Currently I have been restarting the service about once per week or once every two weeks.
Version 5.3.2
Entity Count Across All Connectors: ~1,950,000
Environment3_Extensibility.zip
Host Machine Specs:
CPUs: 8
Memory: 32GB
Hi Beau,
As per our chat today, I have been investigating some disk space issues on "Environment1" and have noticed a large number of files populating the "C:\Users\<IDB Service Account>\AppData\Local\Temp" directory. Please see a few of these files listed below.
It had thousands of files in this directory ranging back to the start of 2019. Not sure if this is related however these files have also been spotted on Environment2 and also Environment3 (although in very small number on environment 3).
Environment1.zipAdditionally while investigating I have also noted a very large number of TCP connections within the performance monitor. There appears to be thousands of these all with a remote port of 59991. I have check on the other environments currently under investigation and all 3 environment also have thousands of these connections.
As a final note too, I have also noticed (though only on environment 1) that under the directory "C:\Users\<IDB Service Account>\AppData\Roaming\Microsoft\Crypto\RSA\<guid>\" there are millions of files with no file type. I suspect this one may be environment related, however just thought I would mention it here as a just in case.
Hopefully this helps to some degree. Let me know if you needed any further information.
Hi Hayden
I've been experimenting in my test environment. The temp files you're seeing are created by the
Import-PSSessionfunction when used in a script run by Broker, but not running the same script from the command line. They are also being automatically cleaned up once the script finishes running, whetherRemove-PSSessionis used or not.This is somewhat at odds with the discussion in this forum thread I found which seems to indicate
Remove-PSSessionneeds to be called to close the session and delete these files. No-one specified what version of PowerShell they were using or how they were running their scripts, though. The second last post suggested something interesting though, running this afterRemove-PSSession.# Force Garbage collection just to try and keep things more agressively cleaned up due to some issue with large memory footprints [System.GC]::Collect() # Sleep 15s to allow the sessions to tear down fully Write-Log ("Sleeping 15 seconds for Session Tear Down") Start-sleep -seconds 15He didn't link to where he found this solution, but the issues the comments allude to that make me think you should add these to your scripts and see if it helps.
Thanks Beau, I'll put in these changes and see how it goes.
Hi Beau,
I have found a couple of import-pssession commands that weren't being removed since we last spoke. I missed these initially as these were being opened from within the configuration where Broker Connector calls the script and not within the script itself. I have added those remove-pssession and garbage collection code segments we discussed previously to those scripts too and remove all the local temp files.
The bad news is since I've made those changes, I don't think this has resolved the clearing of those temp files either:
Could it be an issue with the PSSession being opened from within Broker itself? i.e would I have to also have to run "remove-pssession" within that Broker window too or will running it in the powershell window suffice?
Thanks
You can use
Get-PSSession -ComputerName <computerName>, wherecomputerNameis the network name or IP used to open the session, to get the session object of any open sessions to the specified machine. You could use the returned sessions objects to close them withRemove-PSSession, if there is any, however I'm not sure that will be the case.I've been able to reproduce the issue in my test environment where my remote session is being used to generate large amounts of entity data (roughly 13kb per entity, 100 entities). Running this over a weekend resulted in a sizeable jump in memory usage and the temp directory filled with the temporary PSSession files. The sessions themselves seem to be getting closed properly, though, and the cleaning up of the temp files does happen most of the time, just not not consistently. At this point I'm making the assumption that both the temp files and the unreleased memory are symptoms of the same issue. A post-script up process that isn't happening or is getting interrupted, perhaps. Still looking into it.
Do check your environments for any unremoved sessions, though. My test environment is using a newer version of PowerShell, so there may be some behaviour differences caused by that.
Hi Beau,
Apologies looks like those additional scripts I was talking about in my last post weren't being cleaned up properly from my last change. It appears I was referencing the wrong PSSession variable (for some reason its different to the other scripts in the environment). I've amended the scripts last Friday to reference the correct variable, then cleared the temp directory. I left it to run over the weekend and it appears there are no temp files in the directory. What is interesting though is that the memory usage continued to increase (by about 3 gig in each of the first two environments where the issue is present).
I'll continue to monitor and see if the memory increases during normal weekly operations.
I'll just include here for reference to achieve that above result, I now have all scripts that use an exchange session within a try/catch/finally setup. Of which the 'finally' block is the following for all scripts:
When running the operation in Broker and also observing the temp directory, I can see the temp files get cleaned up roughly 15 seconds before the operation completes in Broker as expected.
I tried running the same in my environment but did not see any change. Temp files were still being sporadically left and memory use was still ballooning.
I have found something that appears promising, though. It seems there may be an issue with the
Import-PSSessioncommand itself, either specifically when it's run in a hosted context, or just in general but not normally noticeable. By removingImport-PSSessionand usingInvoke-Commandto make remote calls instead, my test environment Broker has been maintaining steady memory usage all day. The temp files don't get created when usingInvoke-Command, either, which solves that problem too.Basic usage looks like this:
try
{
    $sess = New-PSSession ...
    $somethingFromRemote = Invoke-Command -Session $sess -ScriptBlock { Get-Something }
}
catch
{
    # handle
}
finally
{
    if ($sess)
    {
        Remove-PSSession $sess
    }
}
See the documentation on
Invoke-Commandfor full usage details, though. You can't use local commands or variables inside theInvoke-Commandscriptblock directly, instead having to pass in parameters explicitly though a parameter array. This may mean the conversion is a little more involved then the previous edits I've suggested, depending on how intertwined they currently are.Hi Beau,
Sorry for the delay on this ticket. But I have finally managed to implement this into production and monitor for a couple of weeks. Even after a restart of the Broker service I am still noticing the memory increase over time (although seemingly not as bad as it was before the change). I will send you through the latest process memory dump to see if there could be anything else here.
Thank you
Hi Team,
Let me know if you didn't managed download the memory dump I sent through and I can send it again.
Thank you
Hi Hayden
Sorry for the delayed response. I took a look at the memory dump and while PSSession related objects are no longer appearing, the majority of space is still being taken up by PowerShell object. Unfortunately, at this point I'm not really able to provide any more assistance, as all the evidence suggests the issue is with something specific to the scripts being run and that's not something we can provide support for.
If the periodic services restarts aren't a suitable workaround and you intend to investigate further, I can provide you with links to the tools I have been using, if needed.