- UNIFYBroker Forum
-
 Questions

Unify.Service.Connect.exe using large amounts of RAM and unresponsive
The Unify Service.Connect process is currently using 786084KB RAM and is unresponsive. It's not writing to Logs and restarting the service has not killed the process.
PS C:\Unify> Get-Process -Name Unify.Service.Connect
Handles NPM(K) PM(K) WS(K) CPU(s) Id SI ProcessName
------- ------ ----- ----- ------ -- -- -----------
209907 5995 2926564 786084 10,599.94 23692 0 Unify.Service.Connect
Answer

There's nothing here for us to go on. Please do some analysis - e.g. look at the last log entry, do a SQL trace, kill the process, etc.
Appears as though it might be in a loop, continually requesting adapter schemas
Had to stop the process so I could continue on working.
Will add to this if it occurs again.
Get-Process -Name Unify.Service.Connect | Stop-Process
This has happened again. Killing process. Please let me know if there is any additional info you want if/when it happens again. I'd like to resolve this prior to putting into UAT if at all possible.
As mentioned in my previous comment, there is not enough information to go on.
Investigate what's happening when the memory blows out, isolate the operations that are running, run a memory profiler, audit the custom connector code, etc.
There are no scheduled tasks currently. I am configuring, and the solution goes unresponsive. Can you provide detail on running the memory profiler? I'll remove the custom connector for the time being.
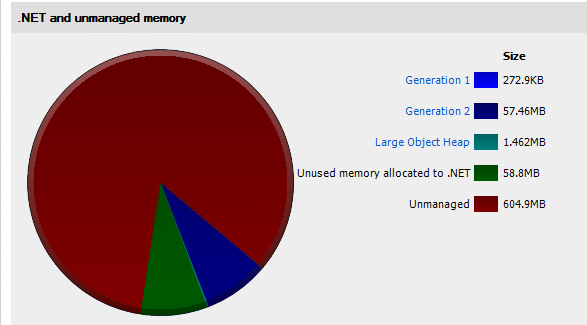
Memory profiler screenshot. Will follow up with additional information.
Find anything interesting? I'm not sure if you have opened the attached results, as they don't appear to contain anything:
OK I had another sample, but it was too large & I couldnt upload it.
This one apparently didnt capture anything. I'll try capture an in-between sample this time.
Does the 600MB Unmanaged memory look unusual to you?
Yes, definitely unusual. An instance I have running (that is actually doing things as well) is sitting at less than 200MB total memory.
The description on unmanaged memory talks about the causes of a leak of this type. I don't recall anywhere that the product uses unmanaged resources (and even if we do I would have imagined it'd have come up before). So I believe a trace that captures the leaking objects will be required. Try doing the snapshots quite close together - if there are no leaking objects keep trying with snapshots further apart. I'm not sure if the results can be compressed, but it's worth trying to see if you can cut back on the size as well.
Thanks.
It compressed down from 200MB to 25MB, but still couldnt upload.
Very likely to be unrelated, but that link refers to GDI errors and I did see these errors recently:
Request to retrieve the Image of the ab07ee6f-418f-4869-bdff-9d5984c7b584 connector errored with message: A generic error occurred in GDI+.. Duration: 00:00:00
Error details:
System.Runtime.InteropServices.ExternalException (0x80004005): A generic error occurred in GDI+.
at System.Drawing.Image.Save(Stream stream, ImageCodecInfo encoder, EncoderParameters encoderParams)
at Unify.Product.IdentityBroker.ConnectorEngine.GetStreamForImage(Image image)
at Unify.Product.IdentityBroker.ConnectorEngine.GetConnectorImage(Guid connectorId)
at Unify.Product.IdentityBroker.ConnectorEngineAuditingDecorator.GetConnectorImage(Guid connectorId)
at Unify.Product.IdentityBroker.ConnectorEngineNotifierDecorator.GetConnectorImage(Guid connectorId)
at Unify.Product.IdentityBroker.ConnectorEngineAccessor.GetConnectorImage(Guid connectorId)
at Unify.Product.IdentityBroker.IdentityServiceCollector.GetConnectorImage(IdMessage connectorId)
at SyncInvokeGetConnectorImage(Object , Object[] , Object[] )
at System.ServiceModel.Dispatcher.SyncMethodInvoker.Invoke(Object instance, Object[] inputs, Object[]& outputs)
at System.ServiceModel.Dispatcher.DispatchOperationRuntime.InvokeBegin(MessageRpc& rpc)
at System.ServiceModel.Dispatcher.ImmutableDispatchRuntime.ProcessMessage5(MessageRpc& rpc)
at System.ServiceModel.Dispatcher.ImmutableDispatchRuntime.ProcessMessage11(MessageRpc& rpc) at System.ServiceModel.Dispatcher.MessageRpc.Process(Boolean isOperationContextSet)",Verbose
That is actually interesting and possibly related. Does that keep happening?
On the memory leak, does it keep growing indefinitely? Or does it hit a plateau?
Can you share a link from OneDrive or SharePoint?
Are you able to send a copy of the extensibility? I'll try reproducing this while you look at the next trace. Also, when starting up a session, can you try enabling the setting "Profile unmanaged memory allocations"? The snapshot doesn't show any of our managed code leaking - there's a large number of items in gen 2, but they're only taking up about 7MB.
I'm happy to work with you in person if you like so that we can get to the bottom of this quicker.
Thanks.
I'm unable to get any leak or memory issues to occur using the same configuration and installs that you're using.
Are you able to run the memory trace using the "Profile unmanaged memory allocations" setting?
To use that setting I need to launch the exe from the memory profiler. When I try to do this, I get the error below. How am I able to successfully launch the IdB exe from within the memory profiler?
Windows Service Start Failure
---------------------------
Cannot start service from the command line or a debugger. A Windows Service must first be installed (using installutil.exe) and then started with the ServerExplorer, Windows Services Administrative tool or the NET START command.

The trace shows no leak between any of the snapshots. Is there a reason there isn't a baseline closer to startup?
What are you doing to reproduce the issue? Has anything changed when this started occurring (e.g. environmental or configuration)? Etc.
I missed this comment.
Is this still an issue? If so, have you been able to capture a trace with a baseline immediately and another baseline after it grows?
Thanks.
I have not seen this issue since the last update. Not sure why that is. No significant changes to the environment have occurred. Probably best to close it & Ill re-open if it arises again .
This condition was has been repeatedly reoccurring in the TEST environment at APRA. Previously it was in DEV.
The error on the Admin page is below. Logs had not been written for several hours by this stage. I suspect the error reported may just be a red herring and due to the condition of the service, but not the root cause.
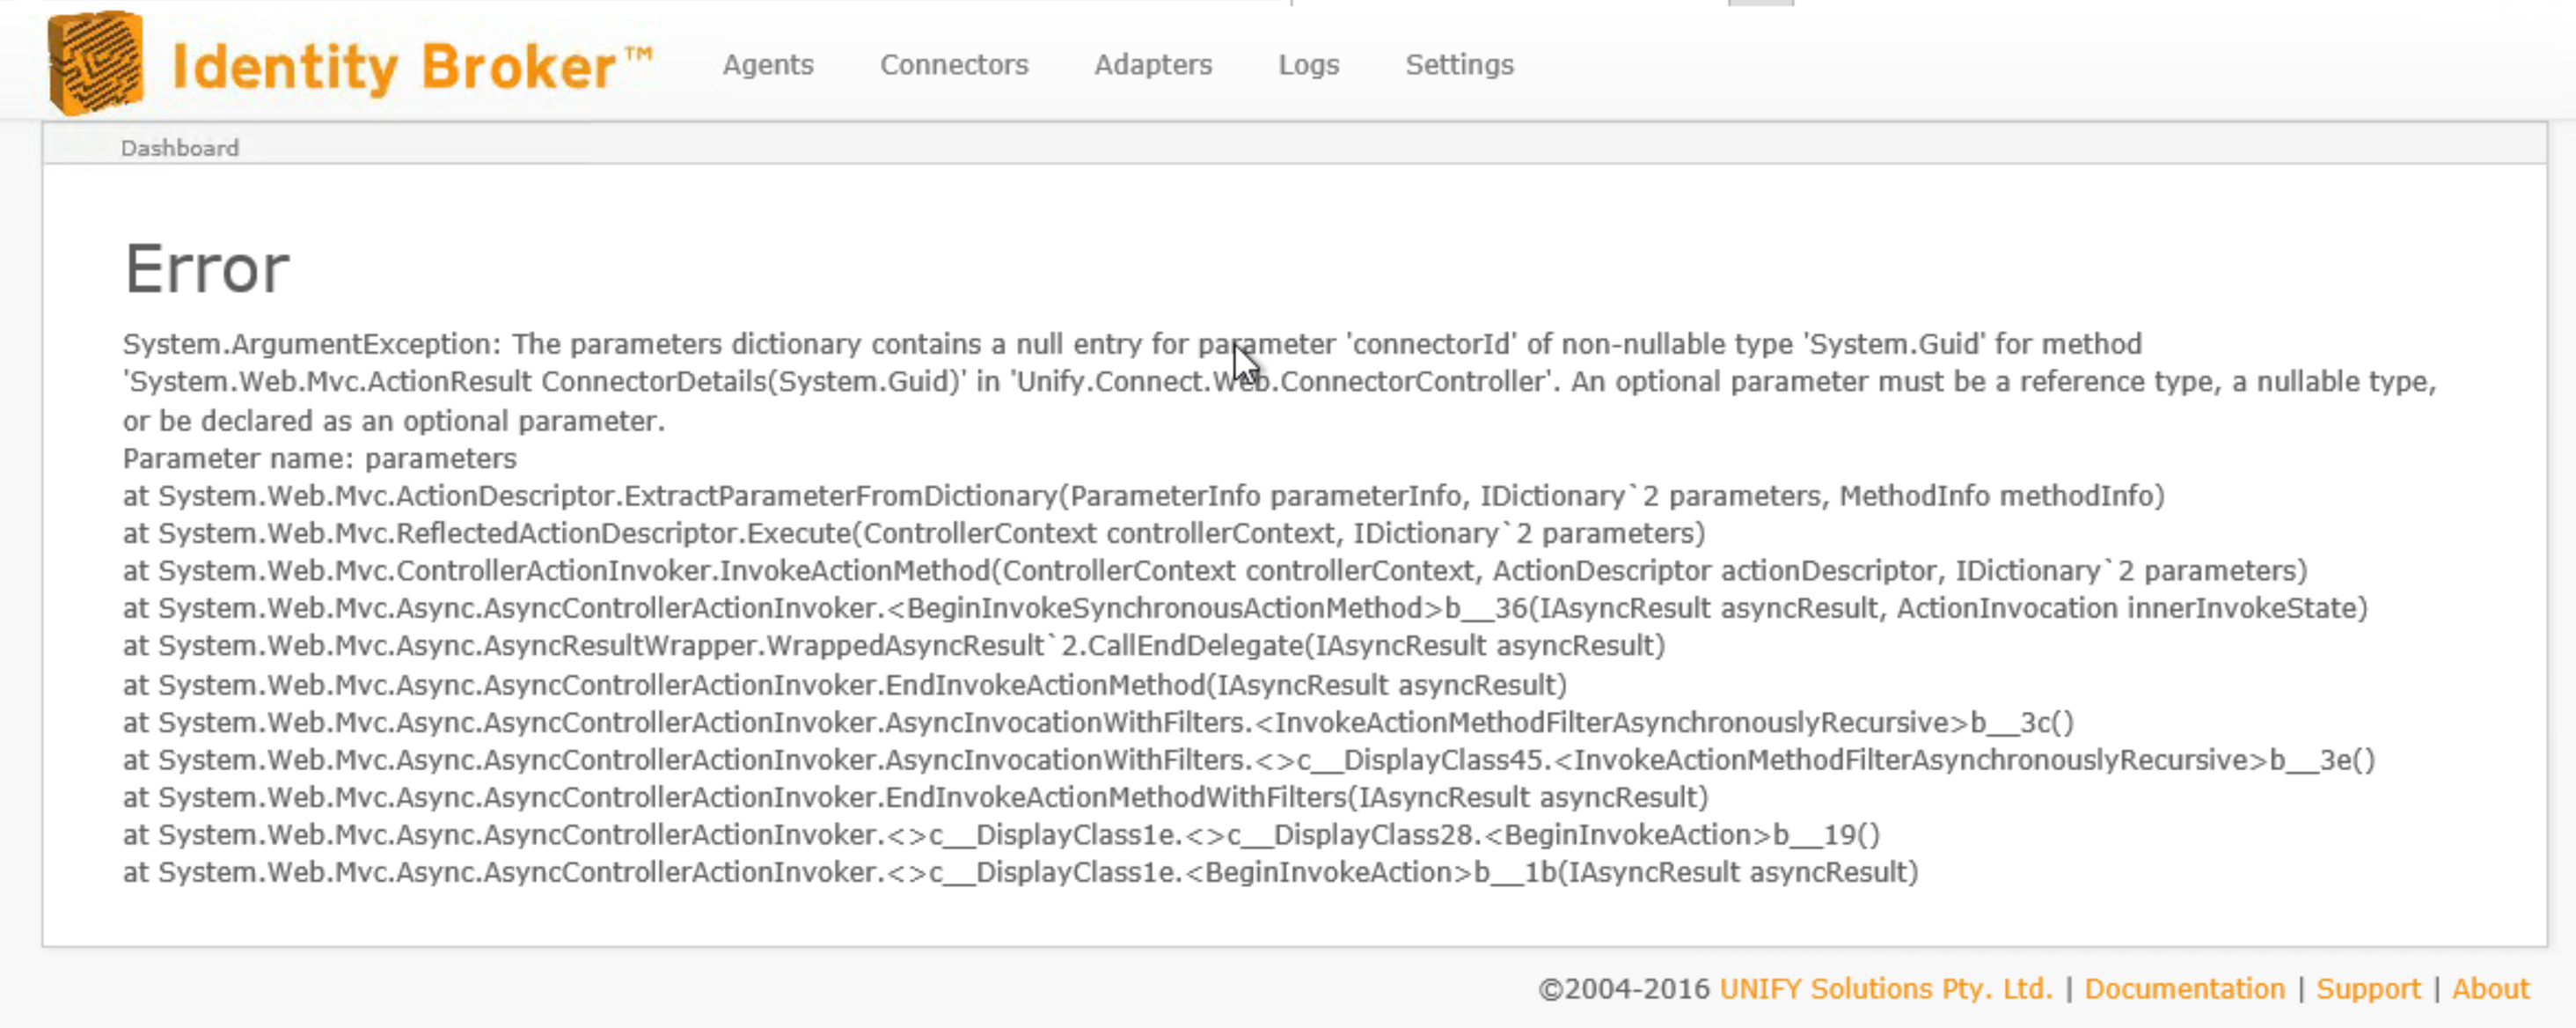
The error in the screenshot is unrelated, it can happen when the website recycles and you attempt to navigate (or the site navigates for you, e.g. on a timer). It'll go away when we do our UI overhaul/rewrite.
As I mentioned earlier:
...capture a trace with a baseline immediately and another baseline after it grows...
Additionally:
- How much memory is on the box?
- What else is running on the box?
- How many entities are managed by the solution?
- Does the box meet the minimum stated requirements for the number of entities?
There's no immediate event on which it grows. This is a gradual process.
As this is Test environment, I'll need to install the profiler software again. I'll also set up a script which runs once per minute and checks the RAM usage of theUnify.Service.Connect.Debug.exe process and alerts me when it increases over 200MB.
That barely meets MIM's minimum requirements. Double check its requirements and Identity Brokers.
When everything is running, there is only 67% RAM usage, so not too concerned about resource constraints. At 80%, I would be more concerned.
That's not really how memory management works, it's very difficult to give a percentage of available RAM - considering there are a number of different ways of measuring it, including private memory that may be paged out to disk (https://stackoverflow.com/questions/1984186/what-is-private-bytes-virtual-bytes-working-set#answer-1986486).
If the behaviour is anything like what I saw when I had similar behaviour, it was sitting at an okay level for RAM, however, there was a ridiculous amount of private bytes - indicating that it was likely swapping out to disk. This was resolved by increasing the RAM to a reasonable level - never seeing the issue reoccur.

I am seeing the same problem at one of my customer sites. IDB service process using 100% of 4 CPUs and unresponsive, 3.2GB in size on a VM with 4 vCPUs and 12GB memory. Restarting IDB has cleared the problem.
I will attach the latest log file here and next time it happens I will obtain more information as per above.
(unfortunately unable to attach log file due to browser incompatibility issues :( )
Customer support service by UserEcho

I have not seen this issue since the last update. Not sure why that is. No significant changes to the environment have occurred. Probably best to close it & Ill re-open if it arises again .