- UNIFYNow Forum
-
 Bugs
Bugs

0
Fixed
Massive memory leak in IE
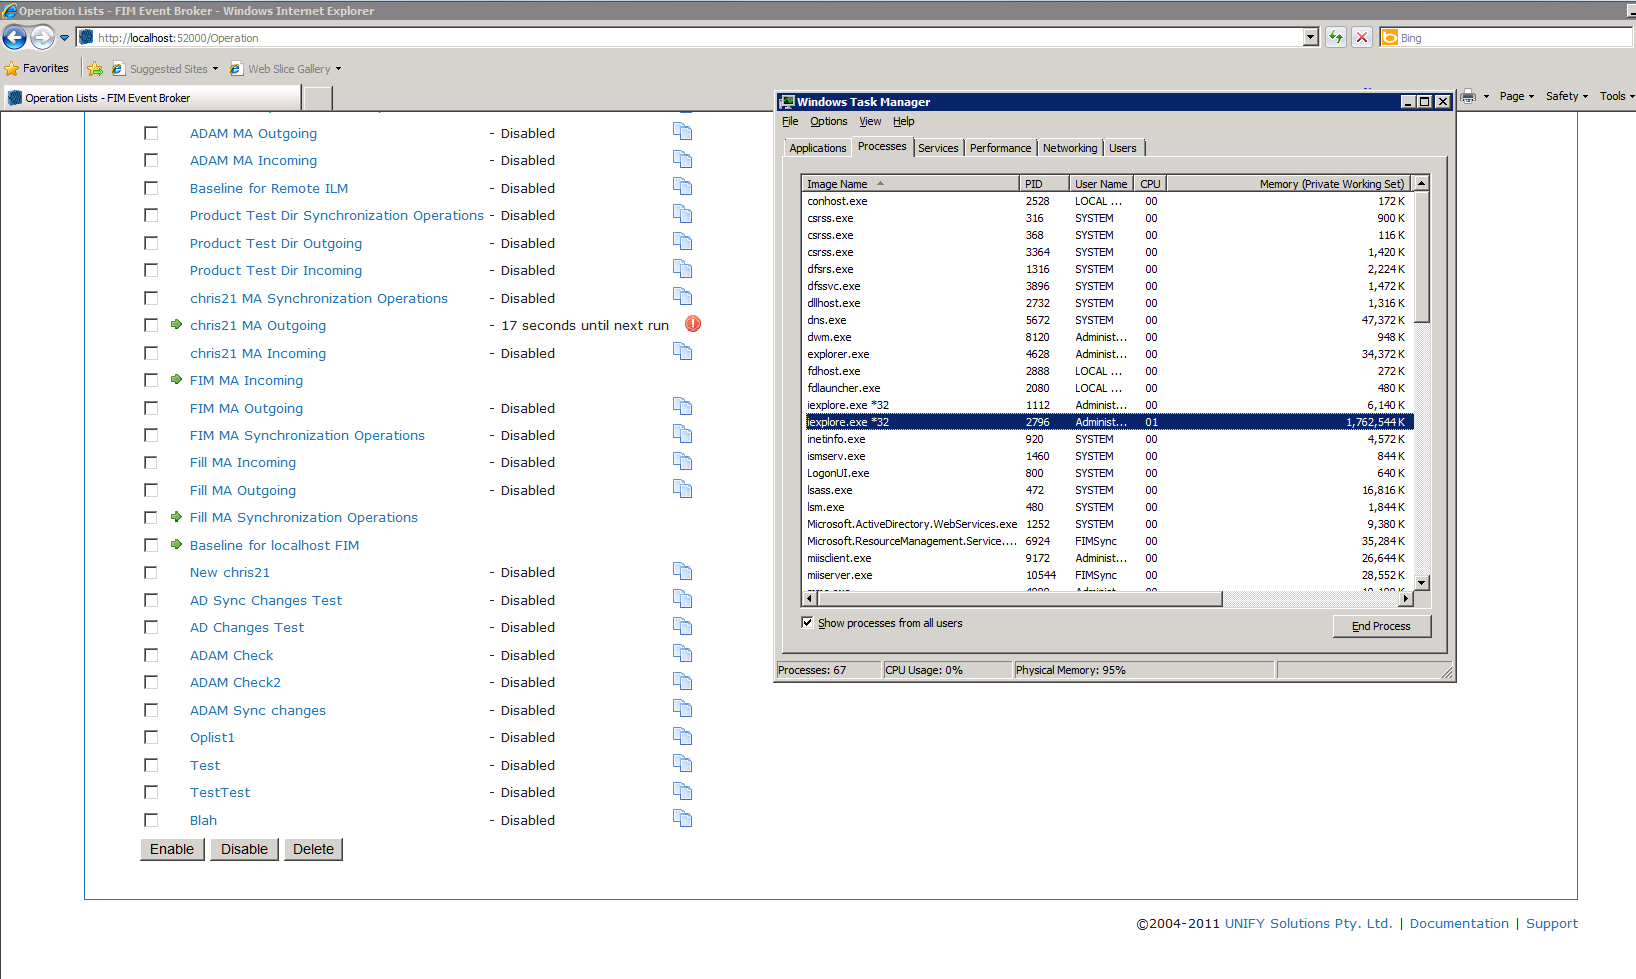
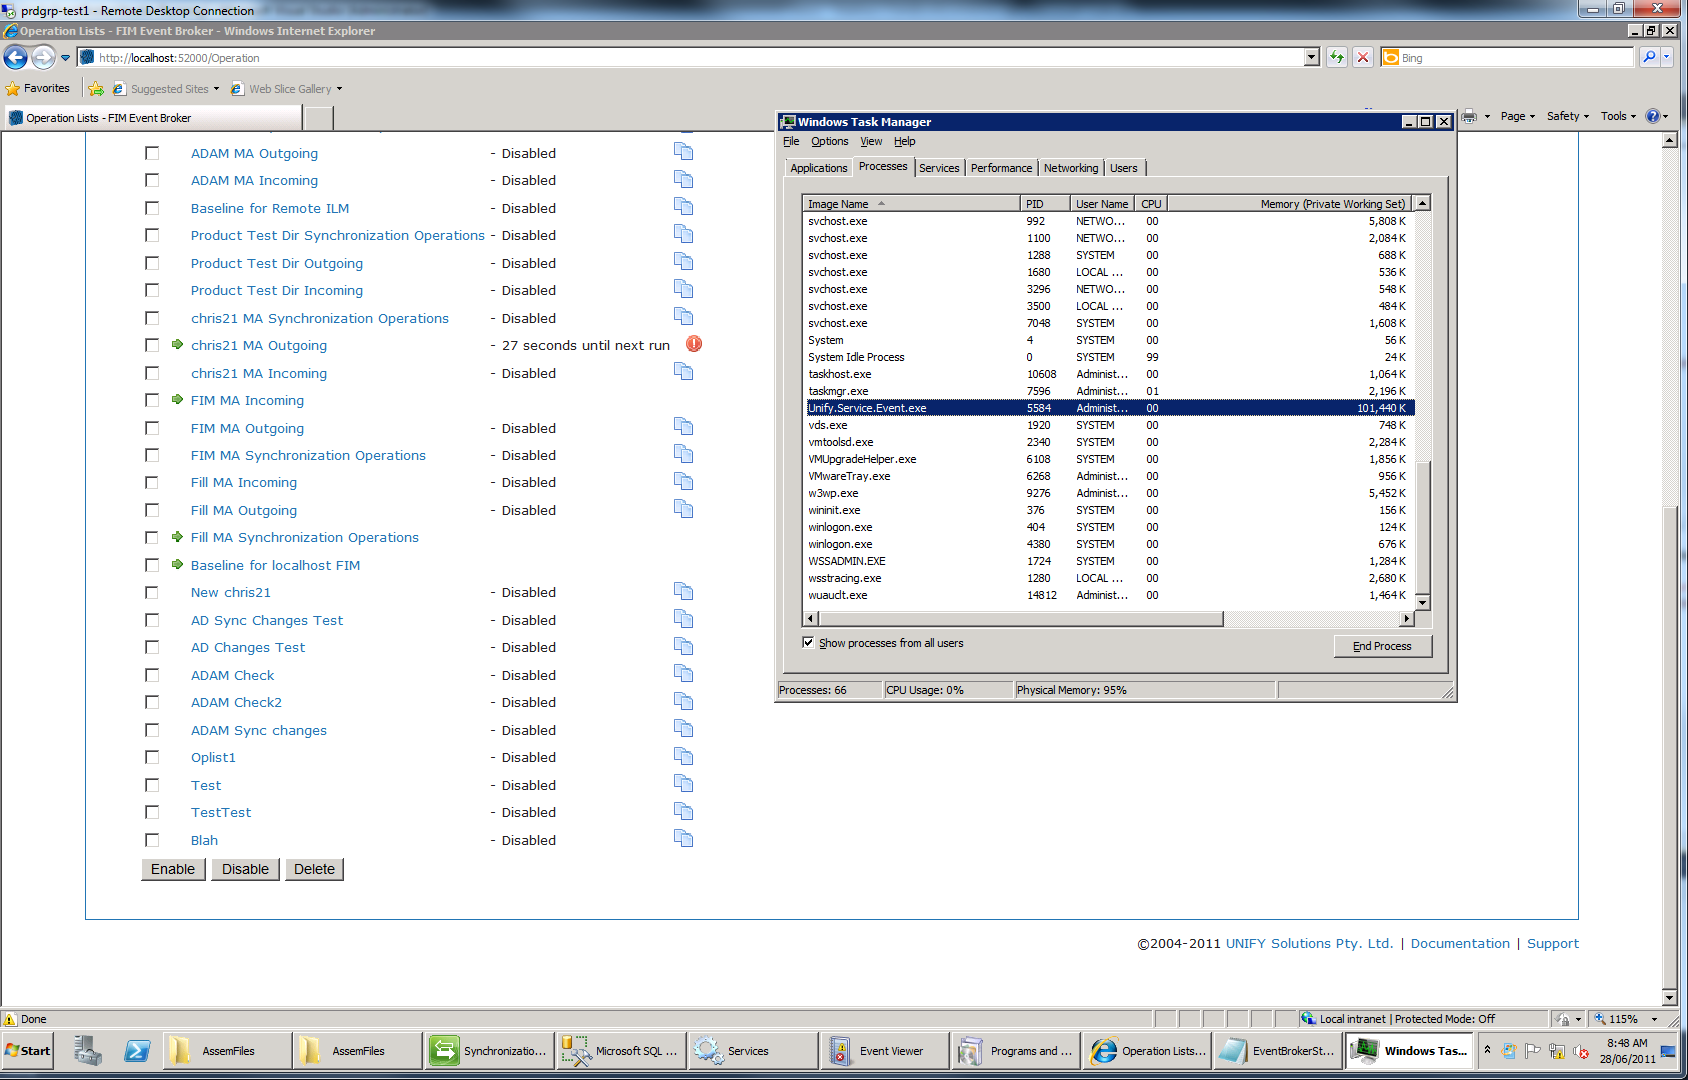
We are currently experiencing some severe memory issues in the Test 1 environment in IE 8. It seems to be exhibited by the Operations screen. I had 3 operations enabled amongst around 30 disabled operation lists. Internet Explorer is sitting at 1.7GB and climbing. The Event Broker service, however, is at normal memory usage (see screenshots).
I have had this screen open in Chrome overnight in the past with a number of operation lists and do not recall seeing this behaviour, although this would be something to investigate also.
Massive Memory Leak in IE.png
Massive Memory Leak - Service is fine.png
Customer support service by UserEcho

Might be worth looking at http://outofhanwell.com/ieleak/index.php?title=Main_Page
If this is helpful, it consider including this in the regression test plan.
Thanks.
JQuery version updated. Left Operations window open in IE 8 overnight (as previously caused the large memory problems). Memory had climbed to 125MB, but stabilized. Browsing from here to the Groups page instantly dropped the memory usage of IE down to 28MB. Tony will test IE 6 using the latest service packs and updates, as apparently this resolves issues with JQuery in earlier versions of IE 6. Refer to the worklogs for more information.
New JQuery version seems to have fixed issues. Assigned to Tony to confirm result in IE 6 with latest updates. Please reopen if this is still an issue.
A memory leak has persisted in IE6 through the recent JQuery changes. This may be due to the design of the operation list index page, and changes will need to remedy this problem.
Memory usage can be forced to spike to quite egregious levels when an expensive call is made multiple times quickly - this memory is not eventually released.
see. Start/Stop scheduler multiple times.
Hi Tony,
If you get a chance can you take another look at this? Even if what we're doing is perfectly fine and the browsers just suck, I'd rather find another way to do whatever it is we're doing because even 200mb for a webpage is way too high.
In regression testing using IE6 with v3.0.1 RC1, the browser is up to 811MB memory usage
Please confirm that the problem is no longer being exhibited in IE7+. If the problem is purely IE6 please resolve as won't fix.
Thanks.
This is happening in IE8
On Test1 (IE8)...
Using memory leak tools sIEve and Drip, I didn't see anything unusual.
Tony, I recommend that the priority be downgraded. If you could also try out what we discussed about destroying the DOM before loading in a new one in the refresh script.
After testing throughout today this looks like it was being cause by the .live call, which attaches to DOM elements directly, and must have been keeping references even after the equivalent .die() method was called. Using the equivalent .on method has stopped this behaviour.
Reassigned for confirmation of completion.
Current implementation was still leaking, but from ~42k -> ~64k overnight.
This issue is still happening in IE9. I left the operation list details page open over night (http://localhost:8080/Operation/OperationList/7479f655-9895-49d0-bcab-d306a60894ab) and it leaked to about 700MB.
The operation list was stopped, had one schedule (every 30 seconds), had three operations, and had a last run statistic.
Navigating away from the page within the same domain did not reclaim the memory. Navigating to another domain did reclaim the memory.
Can this issue be closed? If not, please create a new one that links back to this one stating outstanding work.
Confirmed during testing.
I see this issue is stated fixed, we are running v3.2.1 Revision #3 at HTS on IE8 and we see memory usage go beyond 1.5GB until server has no memory left. Please can you redirect me to the fix?